On February 6, 2020, Twitter published its Q4 2019 results. Although the results considerably missed analysts’ earnings per share expectations, Twitter’s share price immediately shot up by 8.5%. Twitter reported a slight increase in revenue compared to forecasts, but the jump in share price is mainly attributed to an unexpected significant increase in its reported mDAU metric. Monetizable Daily Active Users (mDAU) metric is unique to this company, which until lately has routinely reported using the Monthly Active Users (MAU) metric, used by its industry peers. The relatively new metric measures the number of Twitter users who logged on to the site or used applications that are able to show ads. Average mDAU for a period represents the sum of mDAU on each day of such a period divided by the number of days for the period. In Q4 2019, average mDAU amounted to 152 million, which reflects a 21% increase. According to Twitter, this increase was achieved as a result of product improvements. In order to illustrate the achievement and the trend it represents, it should be noted that in Q1, Q2 and Q3 2019 the increase amounted to 11%, 14% and 17%, respectively.

Public companies’ non-GAAP reporting model, which was developed several decades ago, is based on an outdated concept formed in a world where companies managed brands rather than customers. This outdated approach, whereby a company’s market share is a the only key performance metric that investors will find to be sufficiently relevant, is detached from the revolution that has been taking place for over two decades in the marketing and customer management domains. Similarly, the traditional DCF (Discounted Cash Flows) model for evaluating the overall value of a company can no longer serve to reflect the value of customer-based modern companies. A similar development can also be seen in young start-ups. The main strength of these companies is the customers they have already managed to acquire, and the ones they are expected to acquire in the near future.
A prominent case in point which illustrates the extent to which the traditional reporting and measurement models have become irrelevant in the new world is Amazon, whose current market cap is $1.04 trillion. Based on the company’s net income in 2019 – which amounted to $11.6 billion – the market cap reflects a price to earnings ratio of 90 (= 1,040 / 11.6). Furthermore, Amazon’s market cap reflects a multiple of 16 (= 1,040 / 62) on its accounting equity. Investors seem to see in Amazon much more than it currently has: the customers it already has, from whom much more can be generated in the future – or customers it does not have, but knows how to acquire. However, despite this logical analysis, it seems that there is a small problem here – Amazon does not share with investors the most basic data which is relevant in this context –the number of its users, including the geographical breakdown of users and the changes in user numbers over time, which is essential for identifying trends. Is this something that securities authorities worldwide – and especially the SEC – can and should learn to live with, especially in view of the fact that the traditional models need a significant update?
Customer portfolio
The basis for the managerial customer-based revolution is companies’ ability to collect and analyze data that can be leveraged to accurately manage customer profitability – something that was not achievable in the past. Consequently, new customer management metrics are used as tools for managing companies. One of the key metrics is Customer Lifetime Value – the present value of the future cash flows from a customer. George Popstefanov, founder and CEO of advertising agency PMG, has summarized this issue as follows: “If you don’t have some type of lifetime value calculation, even at a broad level, it will soon be impossible to reach the customers that matter most to your business”. The significance of the above-mentioned revolution is reflected in the mere fact that the Harvard Business Review has dedicated three articles to the subject in its January-February 2020 issue. This is definitely a sign that this is a topic that is currently attracting the attention of the global business community.
This seismic change, whose epicenter is the marketing sphere, has triggered blast waves that impacted financial reporting and company valuations as well. At the end of the day, the assessment of the customers’ profitability – the number of customers a company has, the number of customers it expects to acquire and the projected profits from each of its customers – should serve as the basis for company valuations. This should be applied, at the very least, in companies whose cash flow streams originate mainly from identified customers.
The underlying principle of the new marketing measurement is that companies manage a portfolio of assets – the company’s current and future customers. Any action taken by the company involving its customers – advertising, branding, customer services, sales, investment in social media outlets, collection and analysis of big data – is designed to increase the value of this portfolio, which is called customer equity.
In order to measure the value of customer equity, the data at the individual-customer level should be measured: The cost of acquiring a customer, the projected profitability for each period, and the probability that the customer will remain with the company over the next period (retention rate). When the future cash flows from a customer are discounted based on those data, the result is the Customer Lifetime Value. When combining the Customer Lifetime Value with the estimated current and future number of customers – customer equity can be measured.
The following formula can be used to calculate Customer Lifetime Value (CLV):
CLV = P / (1 + d – R)
P is the earnings for the period (month, quarter, year)
d is the discount rate for the period (a parameter that takes into account the time value of money)
R is the retention rate for the period (the likelihood that an existing customer will stay with the company until the next period)
For instance, if the annual earnings (revenue net of expenses) from a customer are $100, the annual discount rate is 10%, and the likelihood that an existing customer will stay with the company until the next year is 80%, then the Customer Lifetime Value is:
CLV = 100 / (1 + 0.1 – 0.8) = 333
This is a simplified example – a fully Customer Lifetime Value model, which takes into account all of the company’s data, is more complex.
When calculating CLV for a potential customer, the acquisition costs should be deducted.
Obviously, as a forward-looking metric, customer profitability can only be estimated. In addition, there are sectors – such as grocery consumer goods – where individual customer data cannot be accurately tracked yet. However, in many sectors the tracking of such data is definitely possible. Those who collect the correct data and analyze it can understand what should be done in order to increase customer equity. More importantly, with regard to the matter discussed here, those companies can provide more reliable and orderly reports to investors, and to anyone who wishes to assess the company’s value.
In other words, measuring and understanding the way in which customer equity is created is not only an issue for marketing managers or even CEOs. For example, many analysts are interested in the number of new customers who join a company each period. An article published a few years ago describes how Wharton School of Business students “beat” Wall Street analysts at their own game by predicting the number of Dish Networks’ new customers. Wall Street was disappointed with the number of new customers published by the company, and the company’s market cap fell by $1.3 billion. However, the students, who used customer acquisition probability models based on past experience and data, predicted fairly accurately the actual additions of customers in the relevant period. Indeed, this is in no way surprising. Despite the fact that customer equity is at the core of companies’ market cap, most analysts do not necessarily have the background to enable them to understand those issues.
The case of airlines
The largest airlines’ loyalty programs can illustrate the dominance of the value of those programs in relation to the airlines’ market cap. Such simplistic comparison can be made using the loyalty programs’ valuations, which are carried out and published by On Point Loyalty. Without going into discussion about the appropriateness of the methodology used (*), a simplistic comparison between these results and the enterprise value derived from the airlines’ market cap (i.e., market cap adjusted for net financial debt) points to the dominance of the loyalty programs. In five cases, the value of the loyalty programs represents the principal share of the enterprise value; in the case of Air France-KLM, for instance, the value of the loyalty program – Flying Blue – represents almost the entire enterprise value.
Five airlines in which the value of the customer loyalty program represents the majority of the value of the operations (***)
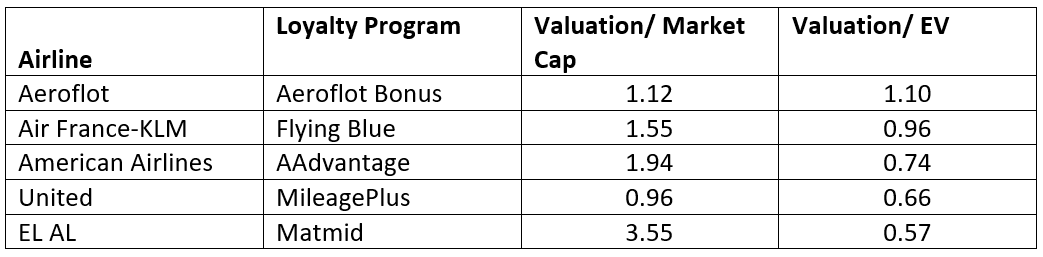
(**) On the methodology used: ttps://onpointloyalty.com/wp-content/uploads/2020/02/On-Point-Loyalty-Top-100-Most-Valuable-Airline-Loyalty-Programs-2020.pdf
(***) Assumptions: The value of the airlines’ loyalty programs is based on analysis carried out by On Point Loyalty as of the beginning of 2020; the market cap used is as of February 6, 2020; enterprise value is calculated as the shares’ market value plus net financial debt.
An example from the Israeli market, which illustrates the importance of customer retention metric (or its converse metric – customer attrition), took place at the beginning of the last decade in connection with the reform carried out in the mobile phone market. Media outlets discussed extensively the decrease in mobile phone companies’ profitability as a result of regulatory changes that had an adverse effect on monthly revenue from customers – but what about attrition rates? According to data published following the reform, the average annual customer attrition rate increased from 18% in 2008 to 31% in 2012. A simple calculation shows that this is a decrease of tens of percent in Customer Lifetime Value, which should have had an immediate impact on the companies’ status and value. In recent years, Israeli mobile phone companies do provide investors with information about customer attrition rates alongside Average Revenue Per User (ARPU) data outside their financial statements. However, these data are partial and non-regulated, and therefore non-comparable – so they are of no significant value to investors. This is the case especially since mobile phone companies do not provide transparent information as to the method they employ to calculate those metrics.
Besides the need to regulate the information in the sectors where it is commonly published, regulators need to acknowledge its importance in other customer-centric sectors that currently do not provide the relevant information – including financial entities, such as banks and insurance companies, which undergo huge changes impacting their customer equity. If, for example, a traditional bank embarks on a strategic move of setting up a digital bank, such a step raises questions about the profitability from those who join the digital bank: Is this a case of acquisition of customers from others or a change in the profitability of existing customers? What is the cost of customer acquisition – and how will such a move impact customer retention? At the end of the day, this involves a change in the Customer Lifetime Value for certain segments; while for the traditional bank as a whole this means a change in customer equity. It is hard to believe that a bank embarking on such a strategic move does not conduct such analyses for internal purposes; however, with no reported data available to them, investors cannot conduct such an analysis on their own.
Immediate upgrading of valuations
In order to better understand the bottom line, investors should receive information about customer management, where the company has such information. Companies’ reporting model, which is stuck in the past, needs to change and focus on the fundamentals of the modern management world: the number of new customers; the cost of acquiring a new customer; profit per customer for the period (month, year) and customer attrition rates. The availability of this information will immediately improve the quality of valuations, since appraisers will be obliged to use the resolution applicable to each company when calculating its discounted cash flows (DCF).
The modern reporting concept should be based on the following principle: The critical information about the business reported to companies’ managers should also be reported to investors. Currently, the reporting of any customer-centric data outside the financial statements is voluntary, and therefore such data is not uniform, and in extreme cases – such as in Amazon’s case – investors are not even provided with the most elementary information. The legal infrastructure whereby companies would be required to provide this essential information is already in place, but securities authorities need to focus on enforcement and clarification – while referring especially to customer-centric information. Managers who claim that they do not collect or use this information are either misleading or, even worse, in serious trouble – and it is important that investors know about that. In that context, it is important to emphasize that the claim whereby companies should not be required to expose the essential data mentioned above, since such a requirement will adversely impact their ability to compete with market peers, is completely contradictory to the concept of reporting by public companies.
It is high time that securities authorities worldwide, especially the SEC, specifically and clearly require public companies to provide investors with basic customer-centric information outside their financial statements, and leave only unique customer metrics as reportable on a voluntary basis. In the current situation, different investors have access to different types of information, and this is a concept that securities laws cannot and should not accept. It would be appropriate to conclude this article with the clear message delivered by Jack Brennan, the former CEO and Chairman of investment giant Vanguard, in an interview to the January-February 2020 issue of Harvard Business Review:
“The place where I’ve seen this play out most aggressively is in private equity. If you talk to private equity firms about the due diligence they engage in when they’re buying a company, the customer base is a critical part of what they’re looking at. It’s intense. They’re asking senior management: What’s the nature of your customer base? How are you acquiring customers? How are you losing them? Which ones are profitable? They’re interested in individual customer accounts and transaction data. A debate is currently going on about whether investors who are buying not an entire company but, say, 1,000 shares should have access to some of the same information about the core value of the customer base that private-market investors see in their due diligence process. I think they should.”
(*) This article was written by Prof. Barak Libai, a marketing expert from the Arison School of Business at the Interdisciplinary Center (IDC), Herzliya, Israel and Shlomi Shuv, Deputy Dean and Head of the Accounting Program at the Arison School of Business at the Interdisciplinary Center in Herzliya, Israel. This article is an updated version of a previous article published by the authors in 2018 in the Hebrew language.